LEADTOOLS Raster Imaging Functionality Samples
| LEADTOOLS Raster Imaging Functionality Samples > Raster Imaging Functionality Samples > Clouds |
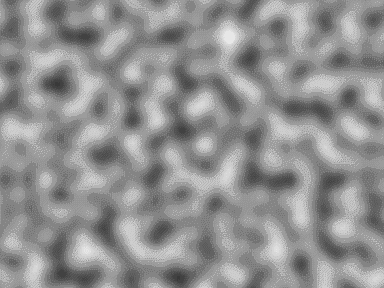
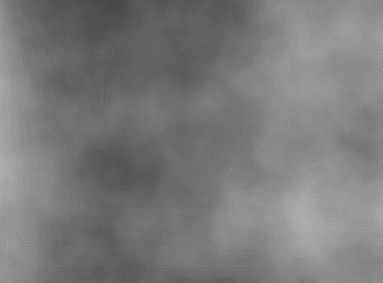
The following two figures illustrate the cloud effect by itself.

This figure was obtained by using the following settings:
|
Parameter |
Value |
|
uFrequency |
16 |
|
uDensity |
1 |
|
crBackColor |
Black |
|
crCloudsColor |
White |
|
uSeed |
0 |
|
Flags |
CLD_PURE |

This figure was obtained by using the following settings:
|
Parameter |
Value |
|
uFrequency |
1 |
|
uDensity |
16 |
|
crBackColor |
Black |
|
crCloudsColor |
White |
|
uSeed |
0 |
|
Flags |
CLD_PURE |
The following two figures show the effects of the function using the CLD_OPACITY flag. If you use the following image

and call this function using the following values:
|
Parameter |
Value |
|
uFrequency |
16 |
|
uDensity |
16 |
|
crBackColor |
Black |
|
crCloudsColor |
White |
|
uSeed |
0 |
|
Flags |
CLD_OPACITY |
|
uOpacity |
50 |
The following figure results:
