| LEADTOOLS Raster Imaging Functionality Samples > Raster Imaging Functionality Samples > Colored Balls |
If you use the following figure.

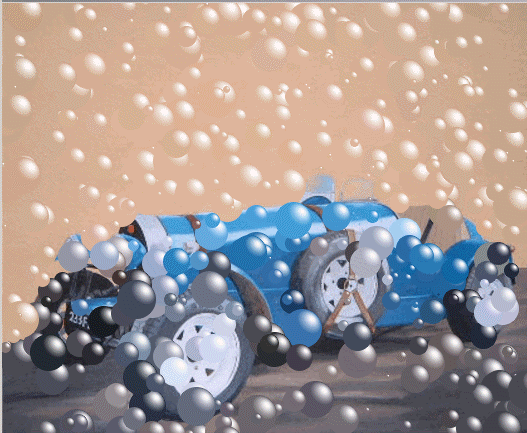
If you call the function using the following values:
|
Parameter |
Value |
|
uNumBalls |
500 |
|
uSize |
10 |
|
uSizeVariation |
90 |
|
nHighLightAng |
315 |
|
crHighLight |
White |
|
crBkgColor |
Blue |
|
crShadingColor |
Black |
|
uAvrBallClrOpacity |
0 |
|
uBallClrOpacityVariation |
0 |
|
uRipple |
4250 |
|
uFlags |
CLRBALLS_SHADING_TOPBOTTOM | CLRBALLS_STICKER | CLRBALLS_IMAGE | CLRBALLS_ BALLCLR_OPACITY |
The following figure will result:

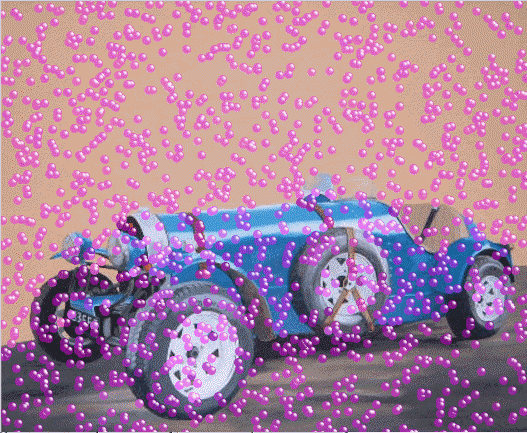
As another example, if you call the function using the following settings:
|
Parameter |
Value |
|
uNumBalls |
1500 |
|
uSize |
4 |
|
uSizeVariation |
0 |
|
nHighLightAng |
315 |
|
crHighLight |
White |
|
crBkgColor |
Blue |
|
crShadingColor |
Black |
|
uAvrBallClrOpacity |
108 |
|
uBallClrOpacityVariation |
13 |
|
uRipple |
1000 |
|
uFlags |
CLRBALLS_SHADING_LEFTRIGHT | CLRBALLS_BALL | CLRBALLS_IMAGE | CLRBALLS_ BALLCLR_OPACITY |
You will obtain the following figure if you use magenta as the color for the balls:
