|
Available in the LEADTOOLS Imaging toolkit. |
Curve Control Dialog
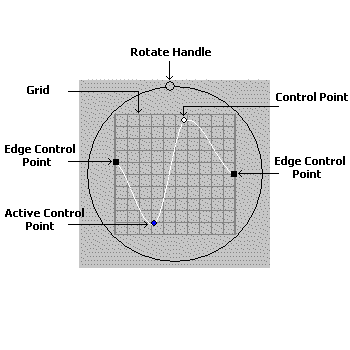
Use the Curve Control to create a data table in which its values are represented by the curve in the grid. You can change the data values by changing the curve. This control contains two major parts, the Grid and the Angle circle.
This Curve Control is available in several dialogs.

The following are the fields in the Curve Control:
Grid
The Grid is a set of intersecting horizontal and vertical lines. Drawn on top of these lines is a Logarithmic curve, an Exponential curve, a Simple curve or a Linear curve. The Exponential and Logarithmic curves are influenced by a Factor value, which you can set. A Simple curve or a Linear curve is drawn through Control points. Control points are small colored circles, can be moved by the mouse in order to change the curve. For a Simple curve or a Linear curve, the grid will contain at least two control points, one on each of the two thick lines at the edges of the grid. These are the Edge Control Points, which are two small squares that move only up and down.
You can add a control point to a Simple or Linear curve by left clicking
within the grid area, but not on the same vertical line as another control
point, as long as the mouse curser is  . You can delete any
control point, except the edge points, by right clicking on the control
point.
To move a control point, place the cursor over the control point, then
click and drag to the new position. When you place the cursor over a control
point, the mouse cursor will change to  .
.
Angle circle
The Angle Circle is drawn round the Grid and contains the Rotate Handle,
a small circle drawn in the angle circle. When you move the mouse over
the Rotate Handle the cursor changes to  . If you move
this handle, the grid will rotate around the Curve control center, changing
the angle of the curve.
Curve Mode Drop-down list box:
Use this to set the type of curve you want to draw. Available values are:
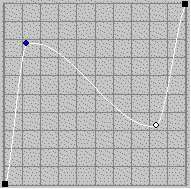 Curve.
Draw a curved line using the control points available on the grid.
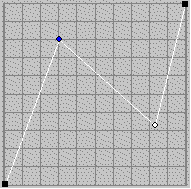 Linear.
Draw line(s) using the control points available on the grid.
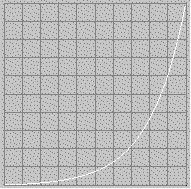 Exponential.
Draw an Exponential line using the Factor value.
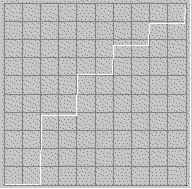 Logarithmic.
Draw a Logarithmic line using the Factor value.
Factor Edit box:
Use the Factor edit box to set the factor for an Exponential or a Logarithmic curve. Enter the value directly in the edit box or use the arrows to set the desired value.
See Also
|
Functions: |